[SLD] Nekaj elektrike
Contents
“Let the future tell the truth, and evaluate each one according to his work and accomplishments. The present is theirs; the future, for which I really worked, is mine.”
Nikola Tesla

Dve stvari za ta zapis:
1. POSIXct
2. ThemeSLD - Graf za porabo elektrike
Datum-čas
Obstaja več definicij časovnih spremenljivk in datumi ter datum-časi običajno predstavljajo kakšno težavo pri uvažanju ali pretvorbah.
POSIXct je število sekund šteto od 1.1.1970. Excel tudi prikazuje datum skozi štetje sekund, le da ima izhodišče v 1899-12-30.
POSIXit je vektorska oblika s sledečimi vrednostmi spremeljivk:
1. seconds
2. minutes
3. hours
4. day of month (1-31)
5. month of the year (0-11)
6. years since 1900
7. day of the week (0-6 where 0 represents Sunday)
8. day of the year (0-365)
9. Daylight savings indicator (positive if it is daylight savings)
Daylight Savings and Time Zones [also hate you]
We can use universal time (UTC) for that. Actually, like specifying the format, it’s a good idea to always specify your time zone even if you don’t use UTC.
R ne prikazuje v zapisu (npr. print) spremeljivk za čas tako, kot jih ima shranjene, zato bodi previden pri kopiranju posameznih elementov zapisa!
excel_datum <-  43547 # 2019-03-23
r_datum     <-  as.Date(excel_datum, origin="1899-12-30")

cat(" excel_datum: ", excel_datum, "\n",
    "r_datum:     ", r_datum, "\n", "\n" )
## excel_datum: 43547
## r_datum: 17978
## print("r_datum s funkcijo print:")## [1] "r_datum s funkcijo print:"print(r_datum)## [1] "2019-03-23"Nekaj uporabnih paketov za delo s časom:
library(lubridate)
library(chron)
in nekaj uporabnih funkcij:
as.Date(“08/30/2012”, format = “%m/%d/%Y”)
Sys.Date()
difftime(Sys.Date(), as.Date(“1970-01-01”), units = “days”)
unclass(as.POSIXlt(Sys.time()))
as.POSIXct(“2008-04-06 10:11:01 PM”, format = “%Y-%m-%d %I:%M:%S %p”)
as.POSIXlt(“2008-11-01 01:00:00”)
round(as.POSIXlt(dts1, format = “%Y%m%d %H:%M:%S”, tz = “UTC”)
now()
zadnji dan v mesecu: ceiling_date(now(), unit = “month”) - days(1)
force_tz(ymd_hms(as.character(now())), “Europe/London”) + dhours(6)
Bližnjica do uporabe datumov v R:
- Cole Beck, 2012: Handling date-times in R
ThemeSLD
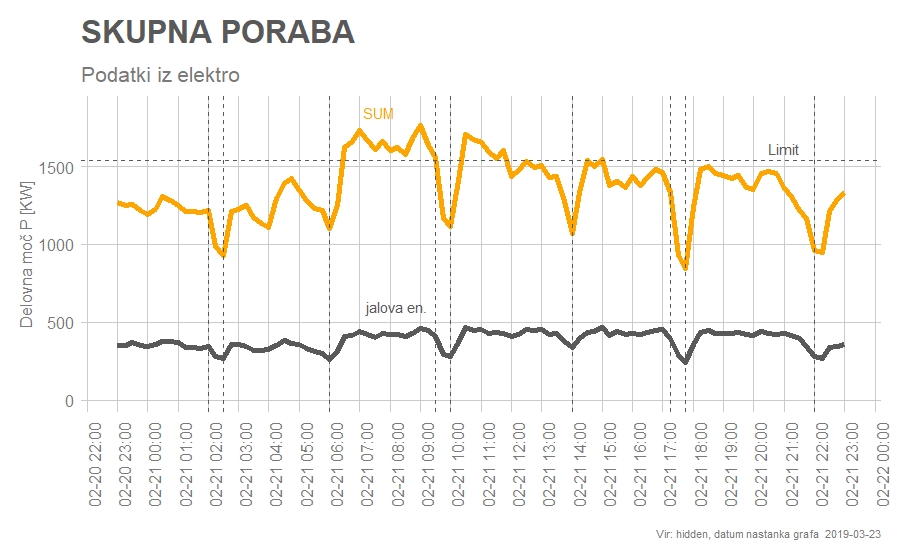
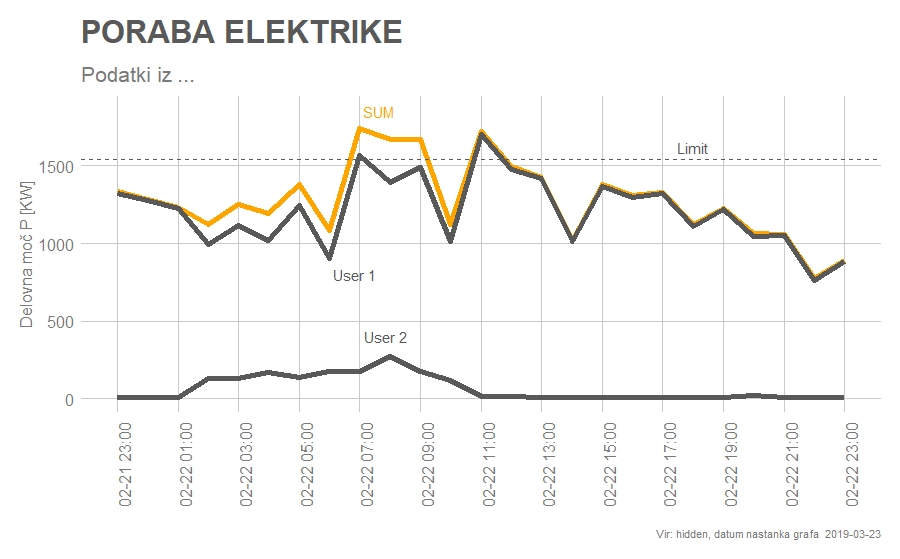
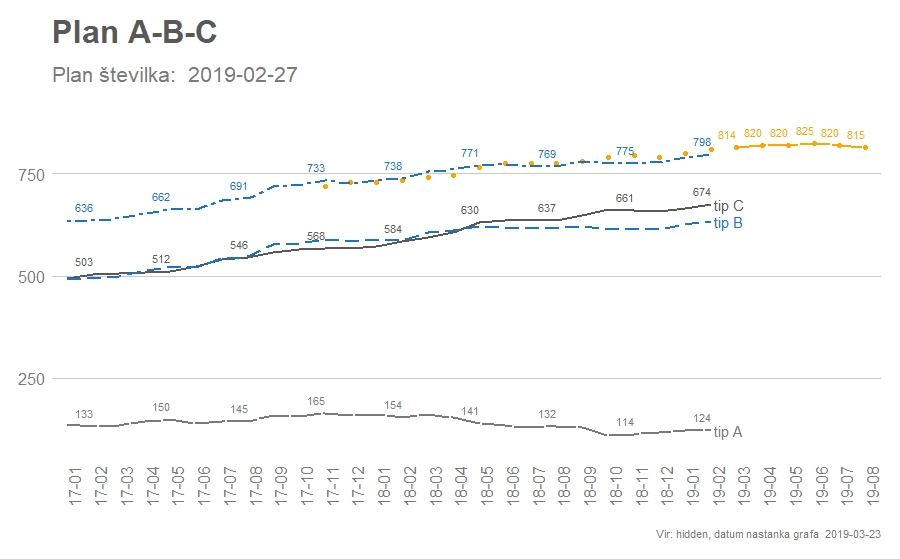
Ne vem od kod sem kopiral original te teme, vendar je rezultat te predelave sedaj sledeč:
Vzorec 1:

Vzorec 2:

Vzorec 3:

Tema je tukaj:
#Original glej v Elektrika2019.R
library(tidyverse)
library(readxl)
library(scales)
library(gridExtra)

themeSLD01 <- function()
{
  #names(pdfFonts()) #prikaze seznam fontov na razpolago.
  font <- "Courier"
  ggplot2::theme(
    plot.margin = ggplot2::margin(0.5, 0.5, 0.5, 0.5, "cm"),
    plot.title = ggplot2::element_text(family = font, size = 24, face = "bold", color = "#595959"),
    plot.subtitle = ggplot2::element_text(family = font, size = 16, color = "#7A7A7A", margin = ggplot2::margin(9, 0, 9, 0)),
    plot.caption = ggplot2::element_text(family = font, size = 8, color = "#7A7A7A"),
    legend.position = "top", legend.text.align = 0,
    legend.background = ggplot2::element_blank(),
    legend.title = ggplot2::element_blank(),
    legend.key = ggplot2::element_blank(),
    legend.text = ggplot2::element_text(family = font, size = 12, color = "#7A7A7A"),
    axis.title.y = ggplot2::element_text(family = font, size = 12, color = "#7A7A7A"),
    #axis.title.y = ggplot2::element_blank(),
    axis.title.x = ggplot2::element_blank(),
    axis.text = ggplot2::element_text(family = font, size = 12, color = "#7A7A7A"),
    axis.text.x = ggplot2::element_text(margin = ggplot2::margin(5, b = 10)),
    axis.ticks = ggplot2::element_blank(),
    axis.line = ggplot2::element_blank(),
    panel.grid.minor = ggplot2::element_blank(),
    panel.grid.major.y = ggplot2::element_line(color = "#cbcbcb"),
    panel.grid.major.x = ggplot2::element_line(color = "#cbcbcb"),
    #panel.grid.major.x = ggplot2::element_blank(),
    panel.background = ggplot2::element_blank(),
    strip.background = ggplot2::element_rect(fill = "white"),
    strip.text = ggplot2::element_text(size = 14, hjust = 0)) }

#orange0, modra, temno siva, siva,
barva = c("orange", "#1874CD", "#595959", "#7A7A7A")

vsebina <- list(
  title = paste("NASLOV"),
  subtitle = paste("Podnaslov"),
  caption = paste("Vir: navedi vir, datum nastanka grafa ", Sys.Date()),
  x = "oznaka x osi"
  y = "oznaka y osi"
)


#Uporaba - samo za prikaz (ne deluje):

ggplot(data=poraba, aes(x=datum, y=P_sum)) +
  themeSLD01() +
  theme(axis.text.x = element_text(angle = 90, hjust = 1, size = 12)) +
  labs(
    x = vsebina$x,
    y = vsebina$y,
    title = vsebina$title,
    subtitle = vsebina$subtitle,
    caption = vsebina$caption) +
  geom_line(aes(y=P_sum), color=barva[1], size = 2) +
  geom_line(aes(y=P_o1), color=barva[3], size = 2) +
  geom_line(aes(y=P_lak), color=barva[3], size = 2) +
  geom_hline(yintercept = 1540, linetype = "dashed", color=barva[3]) +
  scale_x_datetime( breaks=("2 hour"),
                    minor_breaks=("1 hour"),
                    labels = date_format("%m-%d %H:%M"),
                    limits = c(as.POSIXct("2019-02-22"), as.POSIXct("2019-02-23"))) +
  annotate("text", x=as.POSIXct("2019-02-22 8:00"), y=400, label="LAK", col=barva[3], hjust = -0.1) +
  annotate("text", x=as.POSIXct("2019-02-22 7:00"), y=800, label="W1", col=barva[3], hjust = -0.1) +
  annotate("text", x=as.POSIXct("2019-02-22 8:00"), y=1850, label="SUM", col=barva[1], hjust = -0.1) +
  annotate("text", x=as.POSIXct("2019-02-22 19:00"), y=1540, label="Limit", col=barva[3], vjust = -0.5)
Author SlanaD
LastMod 2019-03-23