[SLD] KPI indicator Design
Contents
Manj kot govoriš, bolj ti prisluhnejo.

To je v angleščini. Brez kode sem objavil na LinkedIN
Implementing a good key process indicator (KPI) is difficult but maintaining it is even harder. Fortunately designing the indicator is much easier.
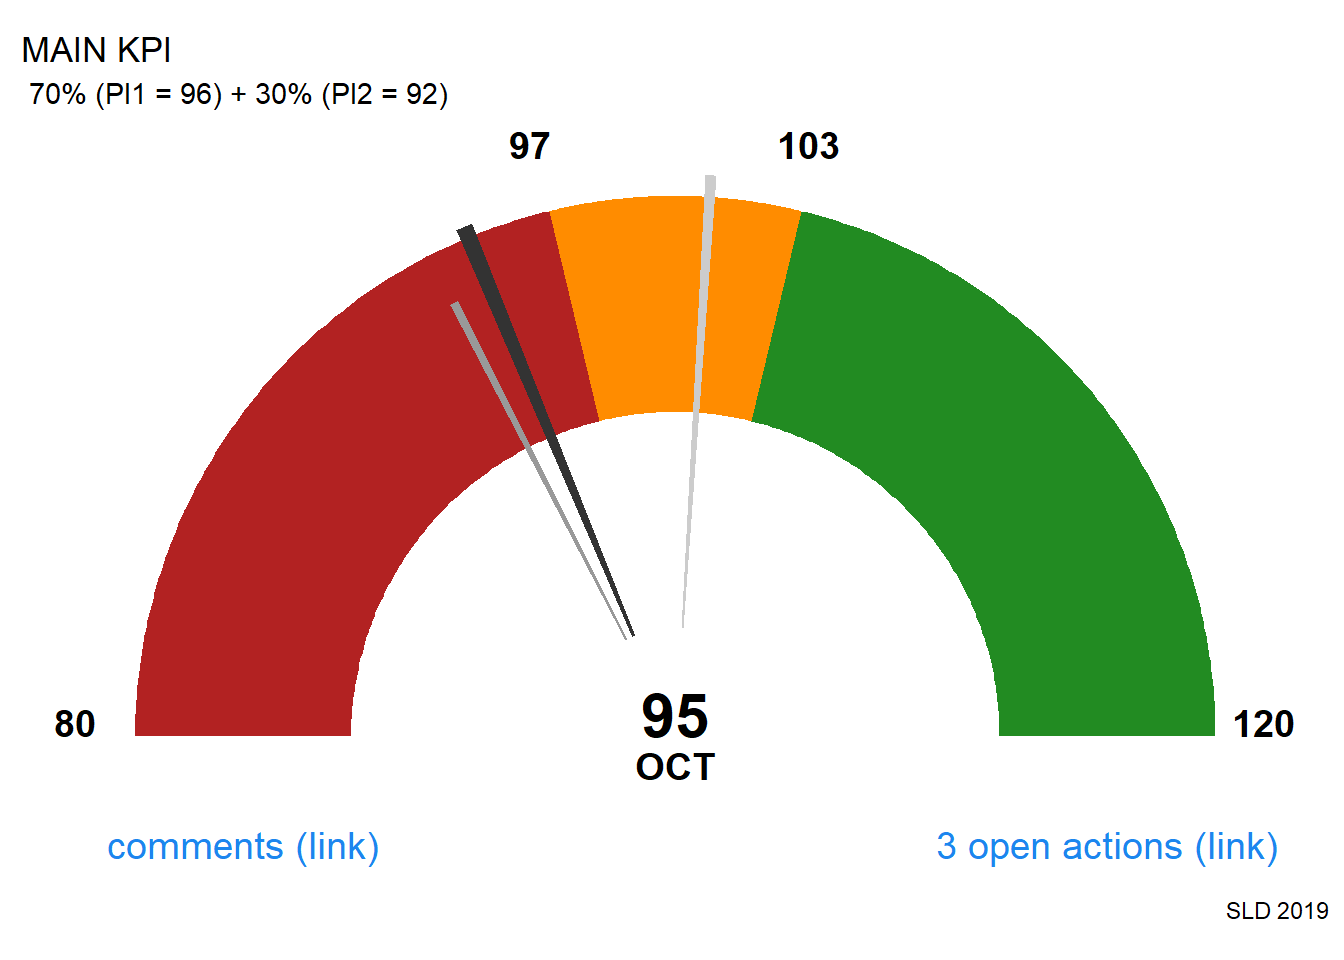
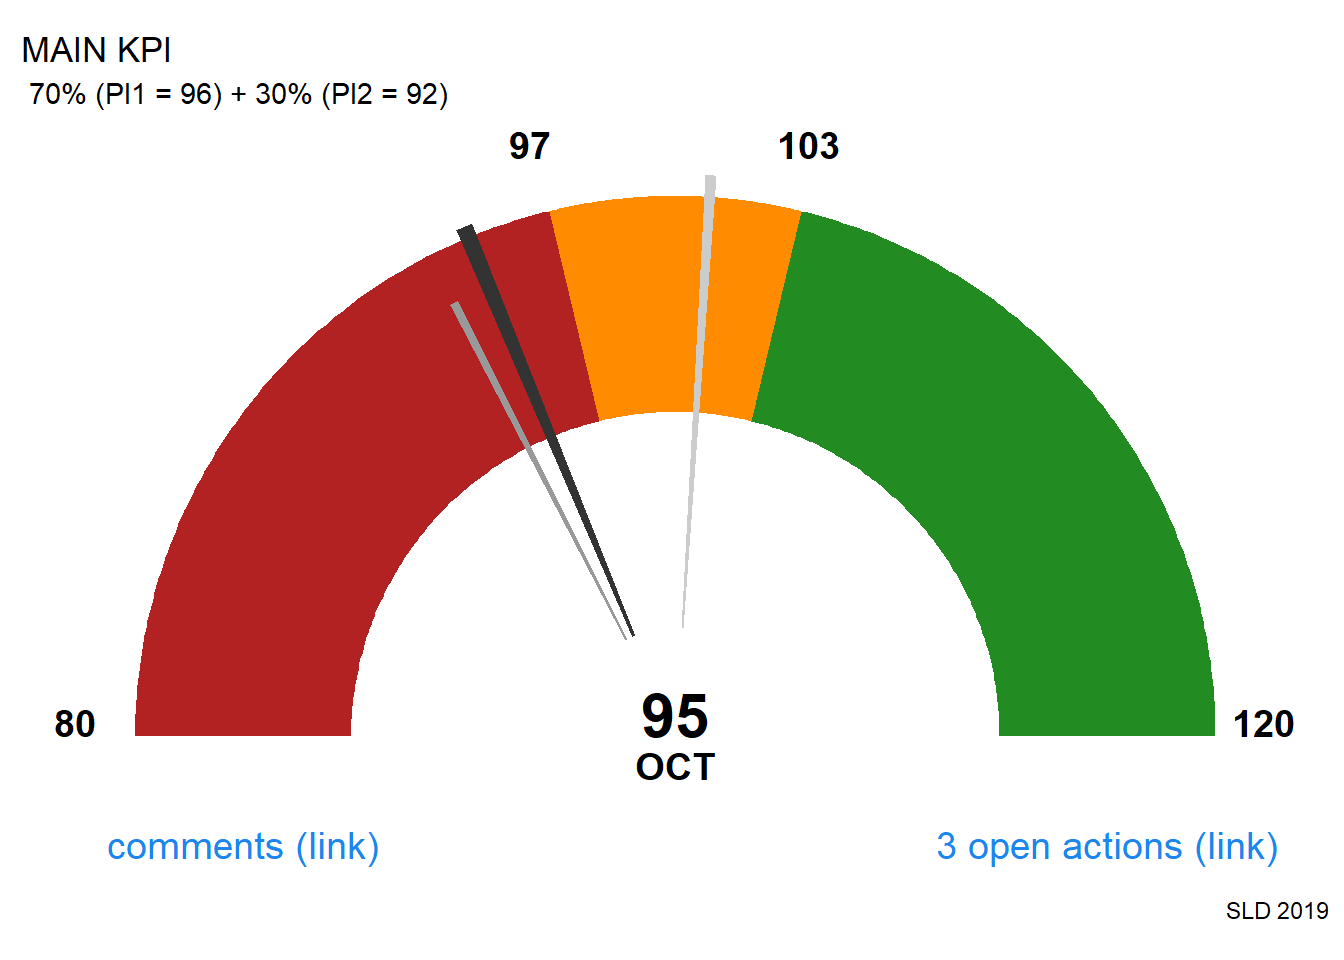
To see this all in one picture, I suggest following design of KPI indicator:
- KPI indicator, like gauge or box plot or …
- TREND indicator, like arrow or simple text (“trend positive”) or value before - now … If possible also prediction.
- COMMENT section, like just links to comments where causes for events, trends, etc., should be explained.
- ACTION section, like number of active actions with links to actions.
KLIKNI ZA KODO: Tukaj je iniciacijska koda s subrutino za GAUGE
KLIKNI ZA KODO: Tukaj je iniciacijska koda s subrutino za GAUGE
```r
# COMMON ROUTINES
#Usually called as:
#source("./lib/SLD_default.R")

#--------------
# COMMON ROUTINES
# Last change: 2019-12-28 SLD

#----- libraries commonly used -----

library(knitr)
library(tidyverse)
library(readxl)
library(scales)
library(gridExtra)
library(chron)
library(reshape2)


#----- Workind directory -----
f_InitDS <- function(working_folder){

  ## Slana, 11.6.2017
  ## choose work folder, create work folder if it does not exist
  ## spremenjeno na GitHub mapo 21.8.2019

  #set working folder
  folder <- working_folder

  path_home <- "D:/OneDrive/GitHub"
  path_work <- "C:/Users/slanad/OneDrive/GitHub"

  if (file.exists(path_home)) {
    path <- path_home
  } else if (file.exists(path_work)) {
    path <- path_work
  } else {
    print("NO CORRECT PATH")
  }
  dir.create(file.path(path, folder), showWarnings = FALSE) #create folder if it does not exists
  setwd(file.path(path,folder))
  cat("Working folder:", getwd(), "\n")
  rm(list=c("folder", "path_home", "path_work", "path"))

  # clean ALL in function
  #rm(list=ls(all=TRUE))

}


#----- graphics ggplot2, SLD theme setup -----
#orange0, modra, temno siva, siva,
barva <- c("#EE7600", "#1C86EE", "#595959", "#7A7A7A")

themeSLD01 <- function(){
    #names(pdfFonts()) #prikaze seznam fontov na razpolago.
    font <- "sans"
    ggplot2::theme(
        plot.margin = ggplot2::margin(0.5, 0.5, 0.5, 0.5, "cm"),
        plot.title = ggplot2::element_text(family = font, size = 24, face = "bold", color = "#595959"),
        plot.subtitle = ggplot2::element_text(family = font, size = 16, color = "#7A7A7A", margin = ggplot2::margin(9, 0, 9, 0)),
        plot.caption = ggplot2::element_text(family = font, size = 8, color = "#7A7A7A"),
        legend.position = "top", legend.text.align = 0,
        legend.background = ggplot2::element_blank(),
        legend.title = ggplot2::element_blank(),
        legend.key = ggplot2::element_blank(),
        legend.text = ggplot2::element_text(family = font, size = 12, color = "#7A7A7A"),
        axis.title.y = ggplot2::element_text(family = font, size = 12, color = "#7A7A7A"),
        #axis.title.y = ggplot2::element_blank(),
        axis.title.x = ggplot2::element_blank(),
        axis.text = ggplot2::element_text(family = font, size = 12, color = "#7A7A7A"),
        axis.text.x = ggplot2::element_text(margin = ggplot2::margin(5, b = 10)),
        axis.ticks = ggplot2::element_blank(),
        axis.line = ggplot2::element_blank(),
        panel.grid.minor = ggplot2::element_blank(),
        panel.grid.major.y = ggplot2::element_line(color = "#cbcbcb"),
        panel.grid.major.x = ggplot2::element_line(color = "#cbcbcb"),
        #panel.grid.major.x = ggplot2::element_blank(),
        panel.background = ggplot2::element_blank(),
        strip.background = ggplot2::element_rect(fill = "white"),
        strip.text = ggplot2::element_text(size = 14, hjust = 0))
}


#----- some nice functins to help -----
## Copy data out of R
CB.to <- function(obj, size = 4096) {
  clip <- paste('clipboard-', size, sep = '')
  f <- file(description = clip, open = 'w')
  write.table(obj, f, row.names = FALSE, sep = '\t', dec = ",")
  close(f)
}

## Paste data into R
CB.from <- function() {
  f <- file(description = 'clipboard', open = 'r')
  df <- read.table(f, sep = '\t', header = TRUE, dec = ",")
  close(f)
  return(df)
}


#------ Gauge plot ------
##Gauge plot
get.poly <- function(a,b,r1=0.6,r2=1.0) {
  th.start <- pi*(1-a/100)
  th.end   <- pi*(1-b/100)
  th       <- seq(th.start,th.end,length=100)
  x        <- c(r1*cos(th),rev(r2*cos(th)))
  y        <- c(r1*sin(th),rev(r2*sin(th)))
  return(data.frame(x,y))
}

gg.gaugeSLD <- function(pos, previous_pos=0, breaks=c(0,30,70,100), sSign="%", sTitle="", sSubtitle="", sCaption="", sUnits="", sColors=c('red','gold','green') ) {
  #Modified from https://stackoverflow.com/questions/24900903/how-to-draw-gauge-chart-in-r
  require(ggplot2)
  get.poly <- function(a,b,r1=0.6,r2=1.0) {
    th.start <- pi*(1-a/100)
    th.end   <- pi*(1-b/100)
    th       <- seq(th.start,th.end,length=100)
    x        <- c(r1*cos(th),rev(r2*cos(th)))
    y        <- c(r1*sin(th),rev(r2*sin(th)))
    return(data.frame(x,y))
  }

  if (previous_pos==0){previous_pos <- pos}
  values <- breaks
  breaks <- (breaks - min(breaks)) / (max(breaks) - min(breaks)) * 100 #normaliziram
  pos    <- data.frame(pos = (pos - min(values)) / (max(values) - min(values)) * 100, value = pos)
  previous_pos <- data.frame(pos = (previous_pos - min(values)) / (max(values) - min(values)) * 100, value = previous_pos)
  values <- data.frame(breaks=breaks, values=values)

  if (pos$pos > max(values$breaks)) {pos$pos = max(values$breaks) + 0.02*max(values$breaks)
  } else if (pos$pos < min(values$breaks)) {pos$pos = min(values$breaks) - 0.02*min(values$breaks)
  }

  ggplot()+
    geom_polygon(data=get.poly(breaks[1],breaks[2]),aes(x,y),fill=sColors[1])+
    geom_polygon(data=get.poly(breaks[2],breaks[3]),aes(x,y),fill=sColors[2])+
    geom_polygon(data=get.poly(breaks[3],breaks[4]),aes(x,y),fill=sColors[3])+
    geom_polygon(data=get.poly(previous_pos$pos-0.3,previous_pos$pos+0.3, 0.2, 0.9),aes(x,y), fill='gray60')+
    geom_polygon(data=get.poly(pos$pos-0.5,pos$pos+0.5, 0.2, 1.02),aes(x,y))+
    geom_text(data=values, size=5, fontface="bold", vjust=0,
              aes(x=1.1*cos(pi*(1-breaks/100)),y=1.1*sin(pi*(1-breaks/100)),label=paste0(values,sSign)))+
    annotate("text",x=0,y=0,label=pos$value,vjust=0,size=8,fontface="bold")+
    annotate("text",x=0,y=-0.08,label=sUnits,vjust=0,size=5,fontface="bold")+
    coord_fixed()+
    theme_bw()+
    theme(axis.text=element_blank(),
          axis.title=element_blank(),
          axis.ticks=element_blank(),
          panel.grid=element_blank(),
          panel.border=element_blank()) +
    labs(
      title = sTitle,
      subtitle = sSubtitle,
      caption = sCaption)
}


# --------------
```
Generiram osnovne podatke:
#Generiram podatke za primer KPI.
# - Meseci bodo index
set.seed(123) #fiksiram seed

KPI01 <- data.frame(MonthF = as.vector(month.abb), KPI = rnorm(12,100,10)) #normalna porazdelitev

KPI02 <- data.frame(MonthF = as.vector(month.abb), KPI = rpois(12,100)) #poissonova porazdelitev

#skupni KPI je 70% prvega in 30$ drugega
KPI00 <- data.frame(MonthF = as.vector(month.abb), KPI = KPI01$KPI * 0.7 + KPI02$KPI * 0.3)

#npr. da za zadnja dva meseva še ni podatkov
KPI02$KPI[12] <- NA
KPI02$KPI[11] <- NA
KPI01$KPI[12] <- NA
KPI01$KPI[11] <- NA
KPI00$KPI[12] <- NA
KPI00$KPI[11] <- NA
Design of KPI indicator
Implementing a good key process indicator (KPI) is difficult but maintaining it is even harder. Fortunately designing the indicator is much easier.
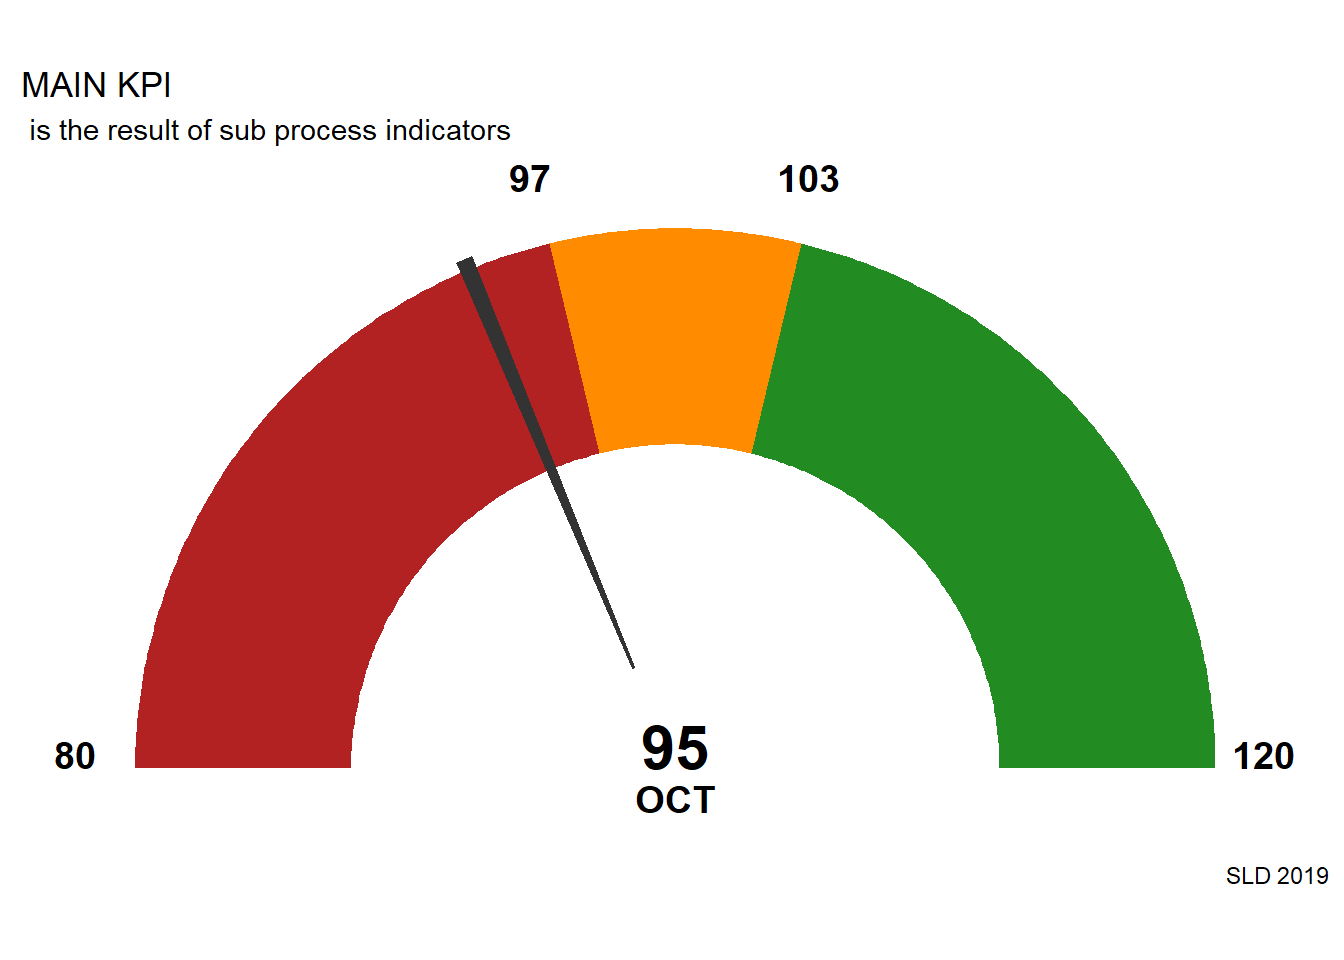
Let say, that you have one MAIN KPI as seen on picture bellow.
dd <- KPI00$KPI
breaks=c(80,97,103,120)
gg.gaugeSLD( ceiling(dd[10]),
             breaks=breaks,
             sSign=" ",
             sTitle="MAIN KPI",
             sSubtitle = " is the result of sub process indicators",
             sCaption="SLD 2019",
             sUnit = "OCT",
             sColors=c('firebrick','darkorange', 'forestgreen'))
For this example this so called Main KPI is the result of 70% of the first process indicator and 30% of the second process indicator and it’s good when it’s value is over 103 and tolerable till is over 97.
dd <- KPI01$KPI
breaks=c(80,100,100,120)
P1 <- gg.gaugeSLD( ceiling(dd[10]),
             breaks=breaks,
             sSign=" ",
             sTitle="PI 1: add 70% to KPI",
             sSubtitle = " is the result of ... (random numbers for this example, normal distr.)",
             sCaption="",
             sUnit = "OCT",
             sColors=c('firebrick','darkorange', 'forestgreen'))

dd <- KPI02$KPI
breaks=c(80,100,100,120)
P2 <- gg.gaugeSLD( ceiling(dd[10]),
             breaks=breaks,
             sSign=" ",
             sTitle="PI 2: add 30% to KPI",
             sSubtitle = " is the result of ... (random numbers for this example, Poisson distr.)",
             sCaption="SLD 2019",
             sUnit = "OCT",
             sColors=c('firebrick','darkorange', 'forestgreen'))


library(gridExtra)
library(grid)
grid.newpage()
grid.draw(arrangeGrob(P1,P2,ncol=2))
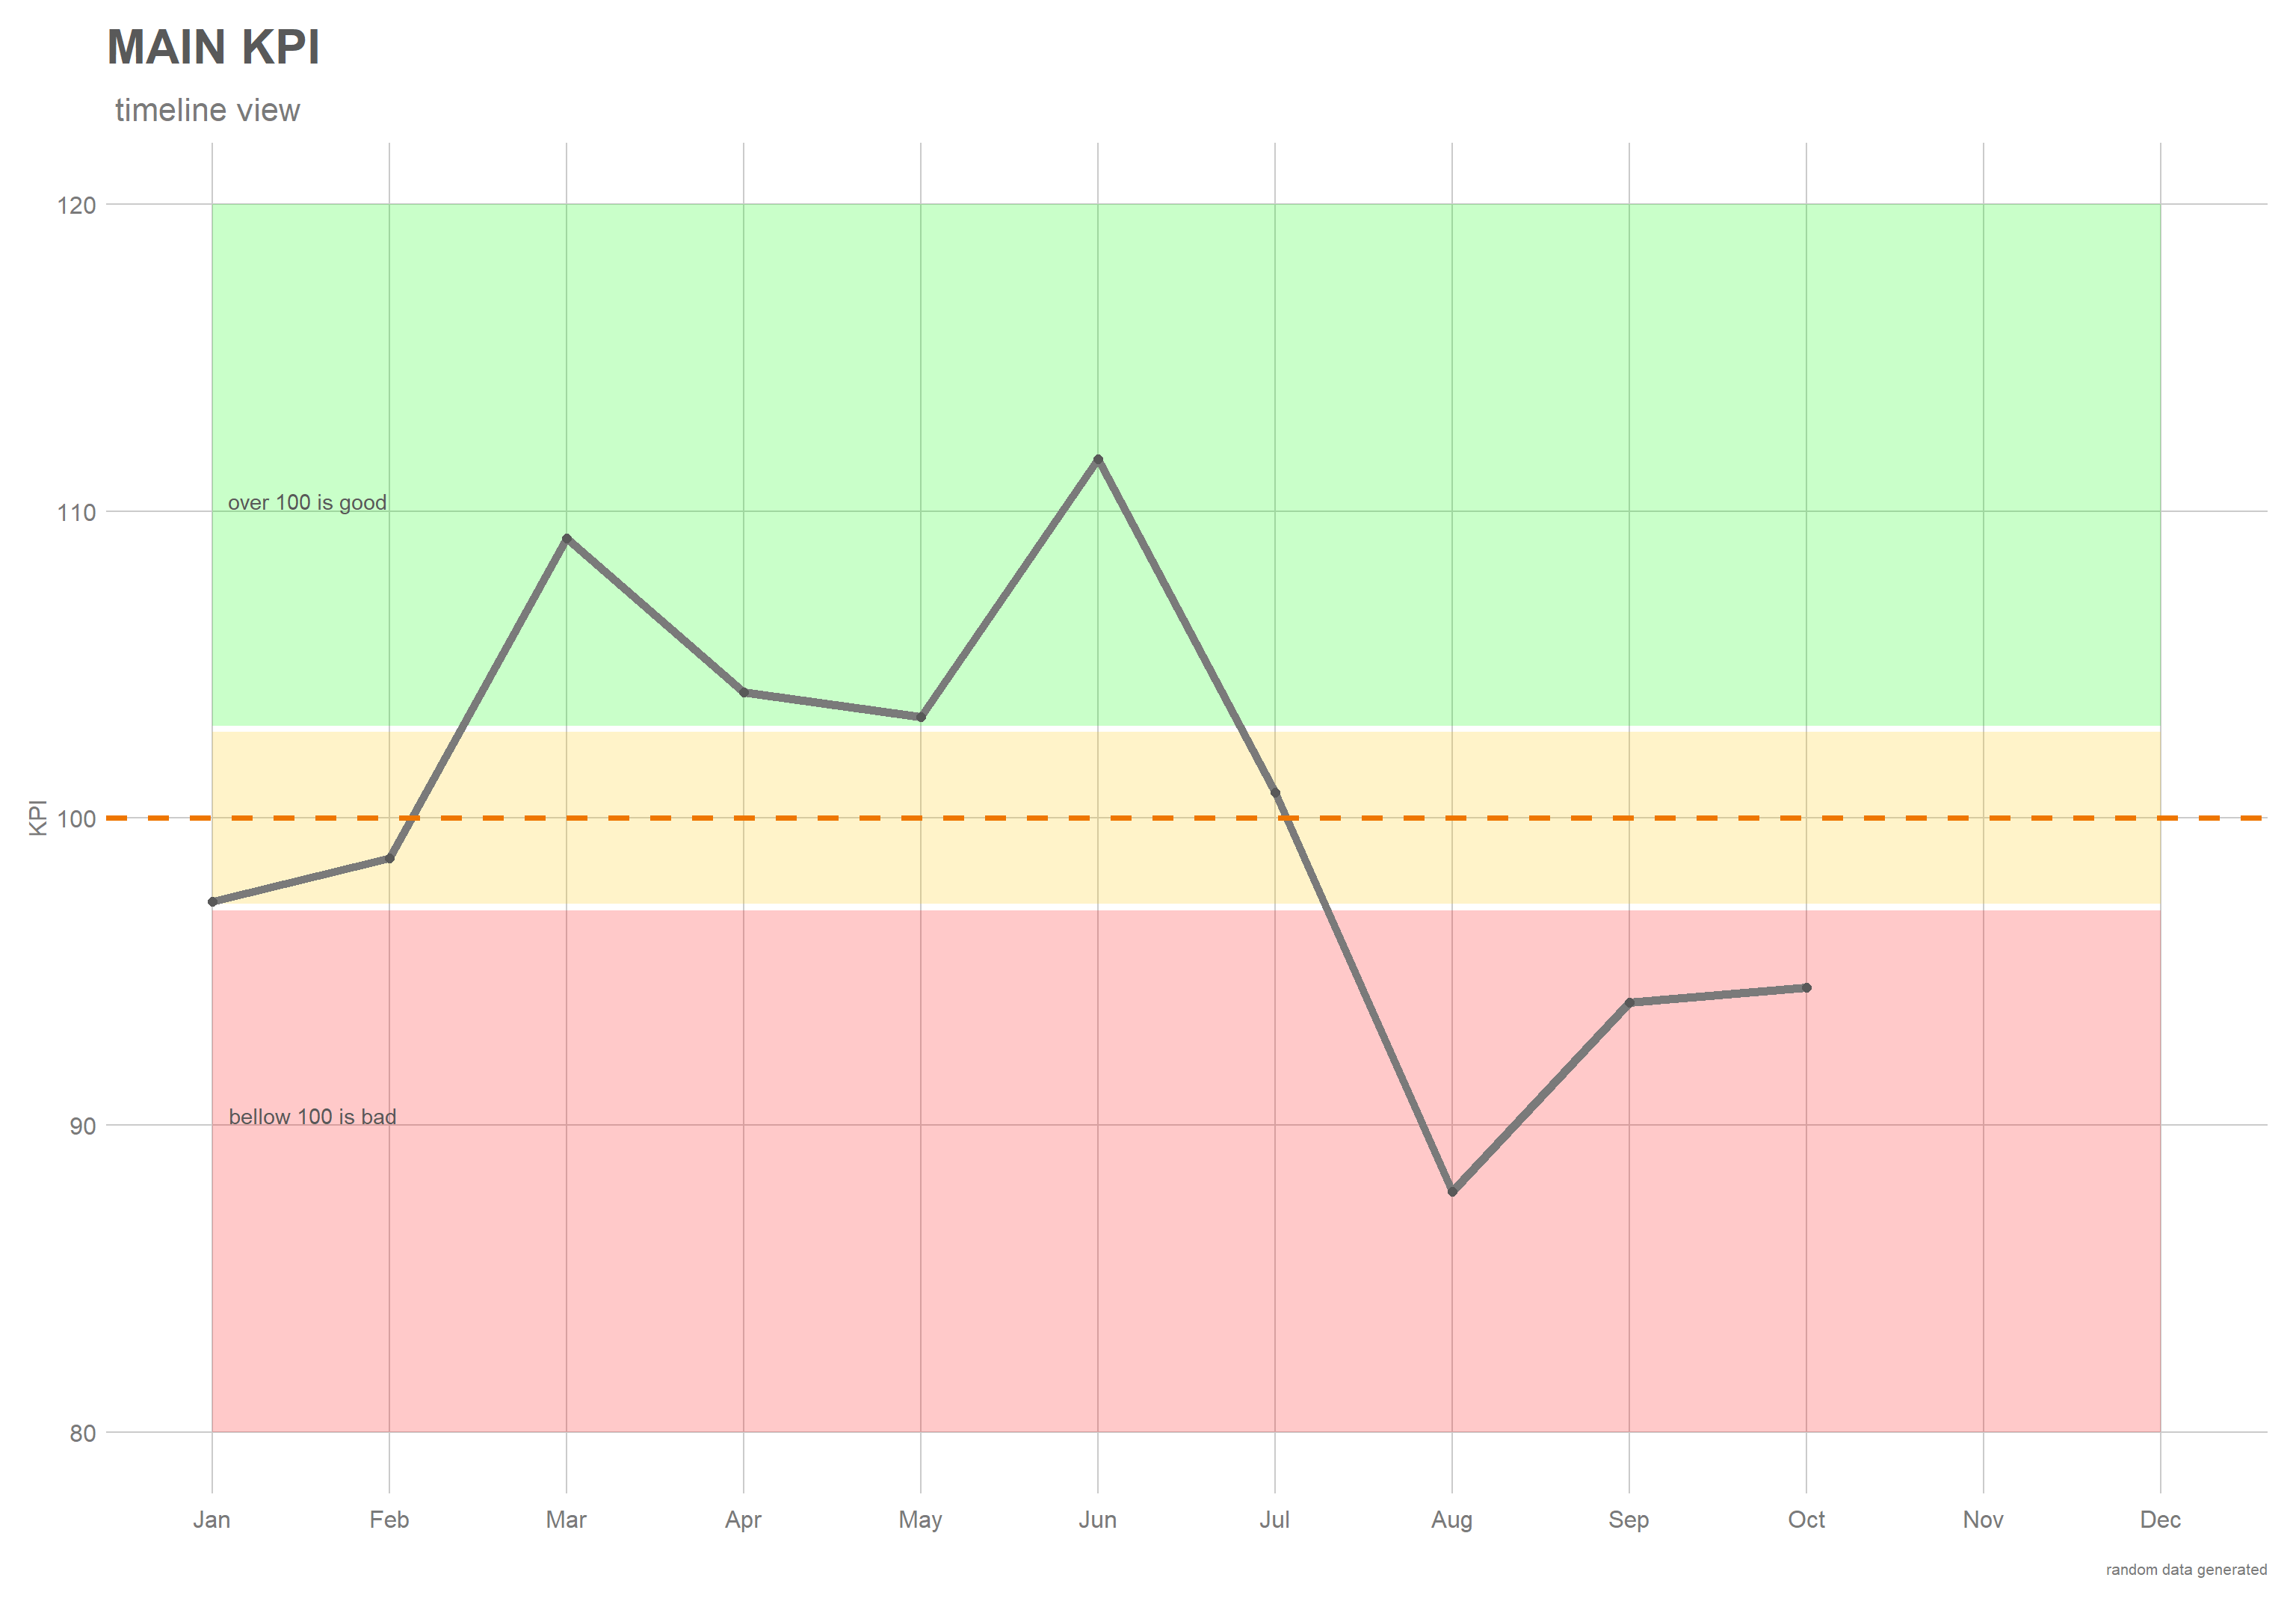
If all values are in RED you need to check how things were developing. Let’s access timeline view.
ggplot(data=KPI00, aes(x=as.factor(MonthF), y=KPI, group = 1)) + themeSLD01() +
    scale_x_discrete(limits=KPI00$MonthF) + #To potrebujes, da ne razvrsti mesecev po abecedi
    labs(
        x = "Month",
        y = "KPI",
        title = "MAIN KPI",
        subtitle = " timeline view",
        caption = "random data generated") +
    geom_rect(aes(xmin="Jan", xmax="Dec", ymin=80, ymax=97), color=0, fill="red", alpha=0.02) +
    geom_rect(aes(xmin="Jan", xmax="Dec", ymin=97.2, ymax=102.8), color=0, fill="gold", alpha=0.02) +
    geom_rect(aes(xmin="Jan", xmax="Dec", ymin=103, ymax=120), color=0, fill="green", alpha=0.02) +

    geom_line(color=barva[4], size=2) +
    geom_point(color=barva[3], size=2) +

    geom_hline(yintercept = 100, linetype = "dashed", color=barva[1], size=1.3) +
    annotate("text", x='Jan', y=110, label="over 100 is good", col=barva[3], vjust = -0.1, hjust = -0.1) +
    annotate("text", x='Jan', y=90, label="bellow 100 is bad", col=barva[3], vjust = -0.1, hjust = -0.1)
So the problem begins already on JUN. Why there is no comment what happened there?
So it would be good to have comments connected to your KPI result, which would describe, why that particular change occured. That goes under maintenance of KPI! You have to comment your past results with the knowledge from today. All PIs show past, perhaps present, but certainly not future. And it would also be good to connect actions to your KPI value. In future you should check if actions are still active and if they are helping to turn the trend.
ggplot(data=KPI00, aes(x=as.factor(MonthF), y=KPI, group = 1)) + themeSLD01() +
    scale_x_discrete(limits=KPI00$MonthF) + #To potrebujes, da ne razvrsti mesecev po abecedi
    labs(
        x = "Month",
        y = "KPI",
        title = "MAIN KPI",
        subtitle = " timeline view",
        caption = "random data generated") +
    geom_rect(aes(xmin="Jan", xmax="Dec", ymin=80, ymax=97), color=0, fill="red", alpha=0.02) +
    geom_rect(aes(xmin="Jan", xmax="Dec", ymin=97.2, ymax=102.8), color=0, fill="gold", alpha=0.02) +
    geom_rect(aes(xmin="Jan", xmax="Dec", ymin=103, ymax=120), color=0, fill="green", alpha=0.02) +

    geom_line(color=barva[4], size=2) +
    geom_point(color=barva[3], size=2) +

    geom_hline(yintercept = 100, linetype = "dashed", color=barva[1], size=1.3) +
    annotate("text", x='Jan', y=110, label="over 100 is good", col=barva[3], vjust = -0.1, hjust = -0.1) +
    annotate("text", x='Jan', y=90, label="bellow 100 is bad", col=barva[3], vjust = -0.1, hjust = -0.1) +
    geom_segment(aes(x="Jun", y=117, xend="Jun", yend=113), arrow = arrow(), size=2, color=barva[1]) +
    geom_label(aes(x="Jun", y=117), size=8, label.size = 0.8, nudge_x = -0.0, nudge_y = 0.5, label = "comment 1, ...", color=barva[1])+
    geom_segment(aes(x="Jul", y=107, xend="Jul", yend=103), arrow = arrow(), size=2, color=barva[1]) +
    geom_label(aes(x="Jul", y=107), size=8, label.size = 0.8, nudge_x = 0.70, nudge_y = 0.5, label = "comment 2, ...", color=barva[1])+
    geom_segment(aes(x="Aug", y=82, xend="Aug", yend=87), arrow = arrow(), size=2, color=barva[2]) +
    geom_label(aes(x="Aug", y=82), size=8, label.size = 0.8, nudge_x = -0.0, nudge_y = 0.5, label = "action 1,...", color=barva[2]) +
    geom_segment(aes(x="Sep", y=88, xend="Sep", yend=93), arrow = arrow(), size=2, color=barva[2]) +
    geom_label(aes(x="Sep", y=88), size=8, label.size = 0.8, nudge_x = -0.0, nudge_y = 0.5, label = "action 2,...", color=barva[2])
To see this all in one picture, I suggest following design of KPI indicator:
- KPI indicator, like gauge or box plot or …
- TREND indicator, like arrow or simple text (“trend positive”) or value before - now … If possible also prediction.
- COMMENT section, like just links to comments where causes for events, trends, etc., should be explained.
- ACTION section, like number of active actions with links to actions.
Example:
dd <- KPI00$KPI
breaks=c(80,97,103,120)
gg.gaugeSLD( ceiling(dd[10]), ceiling(dd[9]),
             breaks=breaks,
             sSign=" ",
             sTitle="MAIN KPI",
             sSubtitle = " 70% (PI1 = 96) + 30% (PI2 = 92)",
             sCaption="SLD 2019",
             sUnit = "OCT",
             sColors=c('firebrick','darkorange', 'forestgreen')) +
     geom_text(aes(x=0, y=-0.7), size=5, nudge_x = 0.8, nudge_y = 0.5, label = "3 open actions (link)", color=barva[2]) +
         geom_text(aes(x=0, y=-0.7), size=5, nudge_x = -0.8, nudge_y = 0.5, label = "comments (link)", color=barva[2]) +
    geom_polygon(data=get.poly(52-0.3,52+0.3, 0.2, 1.04),aes(x,y), fill='gray80')
Not a big change, but now I see from one picture that influence factors for my KPI are PI1 and PI2 with their respective values, I see the trend (grey pointer to black pointer), number of open actions and everything is connected to sub masks for further inspection.
This design is platform agnostic as can be achieved in Excel, PowerBi, Tableau … or even on paper.
Author SlanaD
LastMod 2019-12-28